We use a lot of math at SalesDirector.ai. We use a lot of math to crunch historical data, analyze current data to predict the future outcome of Deals.
To many, AI seems like a black box – elusive, mysterious, complex and unknown. But in spite of the sophisticated and intimidating math that is used in AI, at its core, it is actually surprisingly simple and logical. AI does a lot of the same things that you would normally do “manually” such as making relationships between data points, calculating arrays, means, averages, plotting data, etc. “Non-AI” code can be written to calculate data across multiple databases already – but what AI and distributed computing enables is that it makes it easier to do all of the same stuff – better and AT SCALE – MASSIVE SCALE.
To give you an example – here is how we predict your Worst, Most Likely and Best Case scenarios with your Forecast in SalesDirector.ai?
First we analyze all your historical Closed Won and Closed Lost Opportunities or Deals across a WIDE VARIETY of dimensions, including attributes such as:
- Deal Size
- Sales Rep and/or Sales Team
- Opportunity Type (New Business, Renewal, etc…)
- Product Line
- Lead Source
- Deal Stages and Deal Cycle Times
- How long did it take to go from one stage to another?
- Custom Data/Fields
- All Communication Patterns across Email, Calendering, and Voice/Phone
- How many people were involved
- What Seniority of relationships were required to close a deal
- How engaged were each of those relationships
- What was the Sentiment of those relationships
- How balanced were these Communications
- What kinds of phrases and topics were discussed when in the deal? Example: Was pricing a issue? Did you discuss legal contract terms early on? Was there a hang up on capability of the product or service you are offering? etc…
At each of the data points above, we are calculating ALL KINDS OF STUFF that is being used to “understand” it – such as “# of new deals vs renewal deals”, # of total deals, # of deals per rep, # of deals over time, # of average deals during x time frame, length of time within each stage, average length of time within each stage per rep, total, for the team, etc.
These are just some example of deal points we use to run our analysis.
Now that we know what a Won Deal and Lost Deal look like we then take that “Model” and apply it to all your existing deals. Each Opportunity or Deal then has a expected Worst Case, Most Likely and Best Case Close Date with a appropriate Win Probability.
We take these Dates and Probabilities to formulate the Predicted Month end or Quarter end Outcome.
Worst Case and Best Case being the lower and upper bounds of the Band with a Most Likely being the target.
Here is what your band might look like in month 1 of the Quarter:
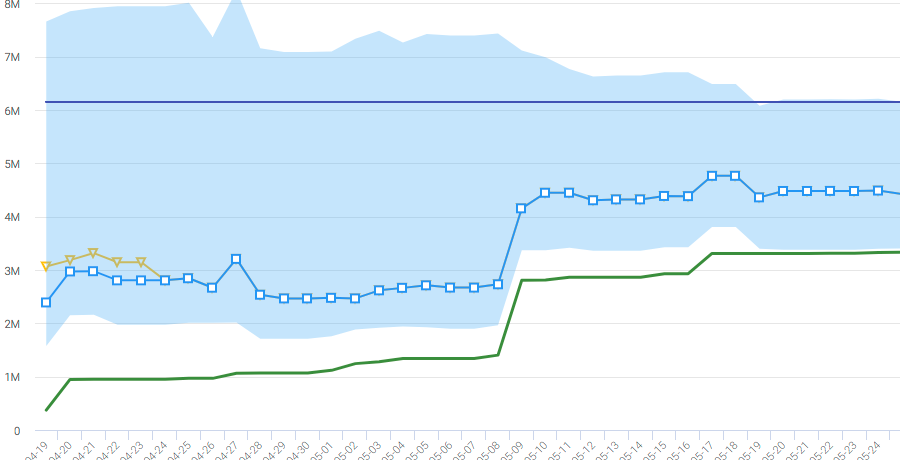
X axis = Time
Y axis = Bookings or Revenue
Green Line = Actuals
Purple Line = Quota Target
Blue Dotted Line = Most Likely
Blue Area = Best Case and Worst Case
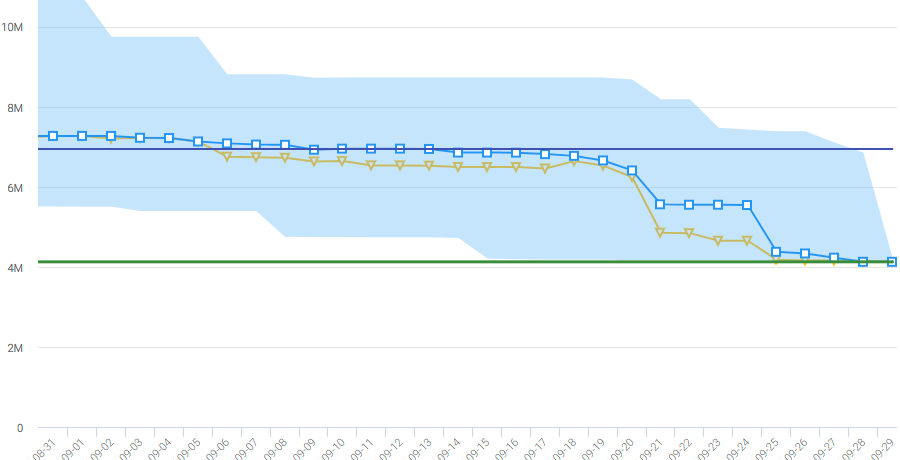
And once you get towards the end of the quarter it might look more like this:
We believe AI is nothing more than what you would normally do already, with the primary benefit of allowing you to do it at scale. Why not leverage data science and computers to do more of the heavy mental lifting for you to free you up to do more high value things like leveraging your experience, seniority and relationships to give the Deal a greater chance of success.
We hope this has helped demystify some of the “AI” blackbox and provides some transparency into “The Model”.
Looking for more depth here or have questions? Let us know.