Understanding how Account Health changes over time is a key insights and visualization that is now available in the SalesDirector.ai Account Module.
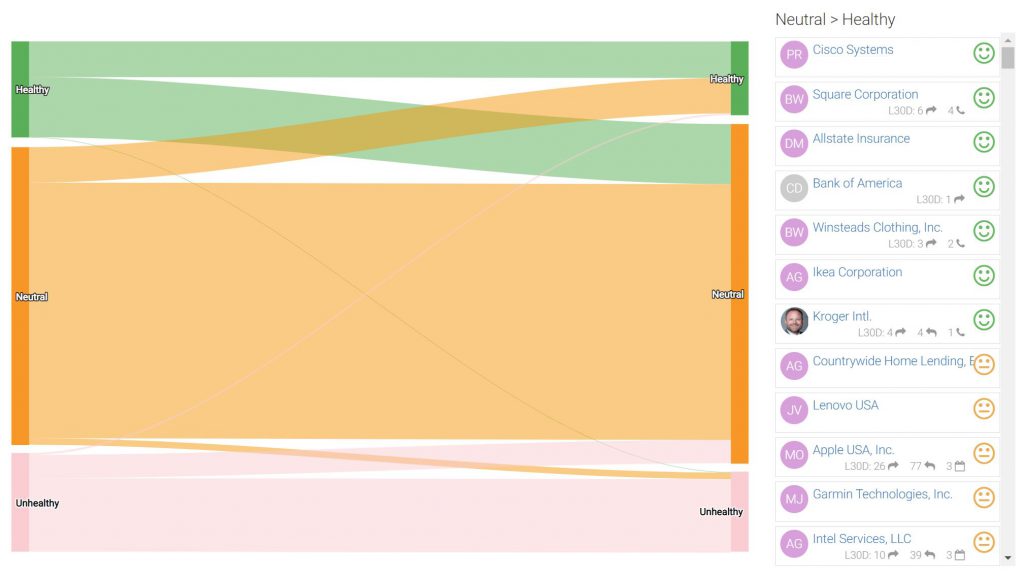
Rather than only seeing a static report that lists the accounts and their health, you can see how your account health is changing over time across your entire account base.
An easy visualization will reveal which accounts are moving “up” in health and are more positive (green) while other colors in orange represent accounts that are neutral and accounts that are trending downward are represented in pink.
At a quick glance, sales leaders and account managers can get a quick understanding of how their work is paying off (or not). Likewise, users can drill down into each category trend and see details of why the account engagement has changed.
Birdseye overviews and trend reports like this are gamechangers for Customer Success Leaders, Account Managers, Renewal Managers and Account Expansion Teams.
The signals that are analyzed to determine Account Health can be customized to include data from CRM, Billing, Product, Support or Customer Feedback (NPS), etc.
To see this report, you must be subscribed to the Account Management Module. Speak to a SalesDirector.ai sales rep today to learn more.